
- Enabling use of FreeBSD repos on pfSense
- Installing the Wazuh Agent for pfSense
- Configuration and Enabling the Agent
- Accessing Wazuh Dashboard & Ingesting Suricata Logs
Enabling use of FreeBSD repos on pfSense
This section will cover how to enable the Wazuh SIEM solution to ingest Suricata logs from pfSense. In order to do this we must first lay some groundwork. Wazuh packages are not part of the official pfSense reposititories, so we are going to need to install our Wazuh agent via the use of the official FreeBSD repos. In pfsense launch a prompt by typing in ‘8’ and hitting enter. By default, FreeBSD repositories are not enabled, so we will need to change that in some config files using the vi editor. If you don’t know how to use vi there are plenty of helpful guides out there. Enter the following commands to alter the config files:
cd ..
vi /usr/local/etc/pkg/repos/FreeBSD.conf
vi /usr/local/etc/pkg/repos/pfSense.conf
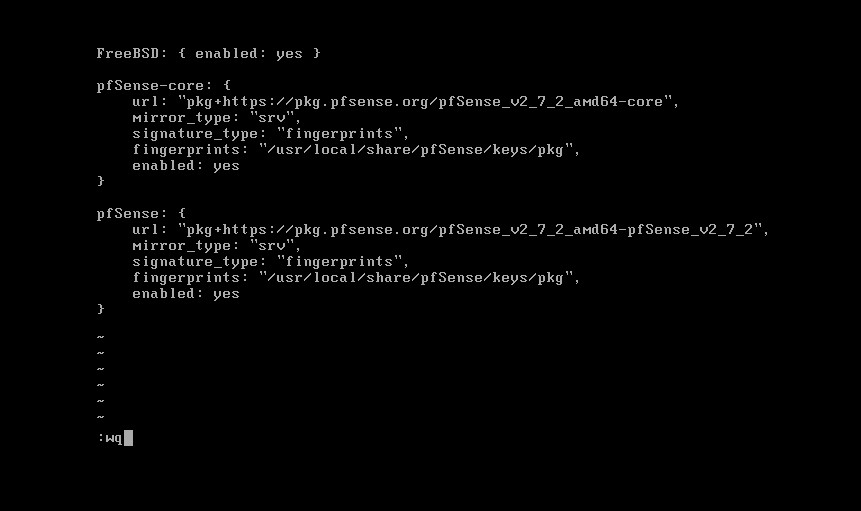
We need to change the following lines as below in both files. When you are done type :wq to write and quit out of vi.
FreeBSD: { enabled: no }
TO
FreeBSD: { enabled: yes }
Installing the Wazuh Agent for pfSense
Now that we have changed the configs, we can go about installing the wazuh agent from the FreeBSD package repository. In order to do this we need to run the following commands:
# we need to update the package cache first, you might get a warning about a mismatch, ignore this and enter 'y' to continue

pkg update

# this searches for the official wazuh agent

pkg search wazuh-agent

# replace the x.x.xx with the version of wazuh you have installed on your server or ova installation

pkg install wazuh-agent-x.x.xx
Once the installation process is done, we will need to revert the config files back to how they were before.
FreeBSD: { enabled: yes }
TO
FreeBSD: { enabled: no }
Once you’ve reverted them back to base, run these two commands as well
pkg clean
pkg update
Configuration and Enabling the Agent
The installation is now finalized! In the output after the installation we were given these suggestions, so let’s go ahead and do that in order.
--
Wazuh Agent was installed

1) Copy /etc/locatime to /var/ossec/etc directory

   # cp /etc/localtime /var/ossec/etc

2) You must edit /var/ossec/etc/ossec.conf.sample for your setup and rename/copy
   it to ossec.conf

   Take a look wazuh configuration at the following url:

   https://documentation.wazuh.com/current/user-manual/index.html

3) You can find additional useful files installed at

  # /var/ossec/packages_files/agent_installation_scripts

4) Add Wazuh agent to /etc/rc.conf

  # sysrc wazuh_agent_enable="YES"

5) Start Wazuh agent

  # service wazuh_agent start

6) Enjoy it ;)
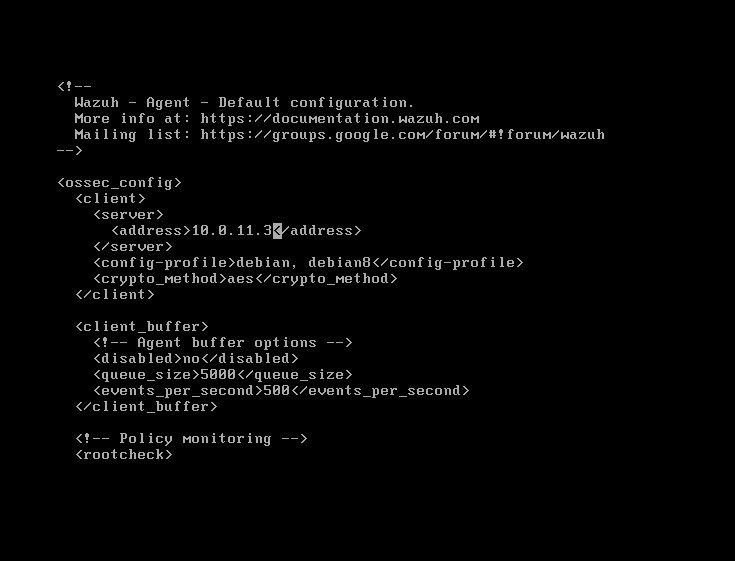
First, it recommends we copy the /etc/localtime to /var/ossec/etc, we can do that with the command it gave us above. Once that’s done we need to edit the config file. It says we need to rename the sample, yet it already created a config file for us, so we can ignore this step. Vi into the file and change the IP address to that of the server where the manager is stored. For us, that should be 10.0.11.3. Write and quit out of vi.
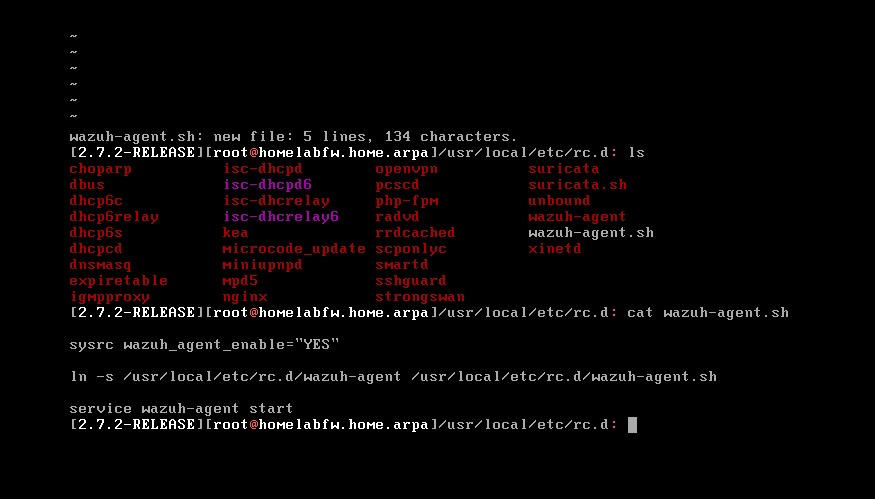
We’ve already done the groundwork for each of our interfaces by enabling JSON output to the syslog of pfSense, so now let’s start the agent. Run the following commands:
sysrc wazuh_agent_enable="YES"
service wazuh-agent start
You would need to do this every time you boot up pfSense, but if you wanted to automate the commands you could create a shell script that automates the process. Place them in the /usr/local/etc/rc.d directory. It might look something like the image below.
Accessing Wazuh Dashboard & Ingesting Suricata Logs
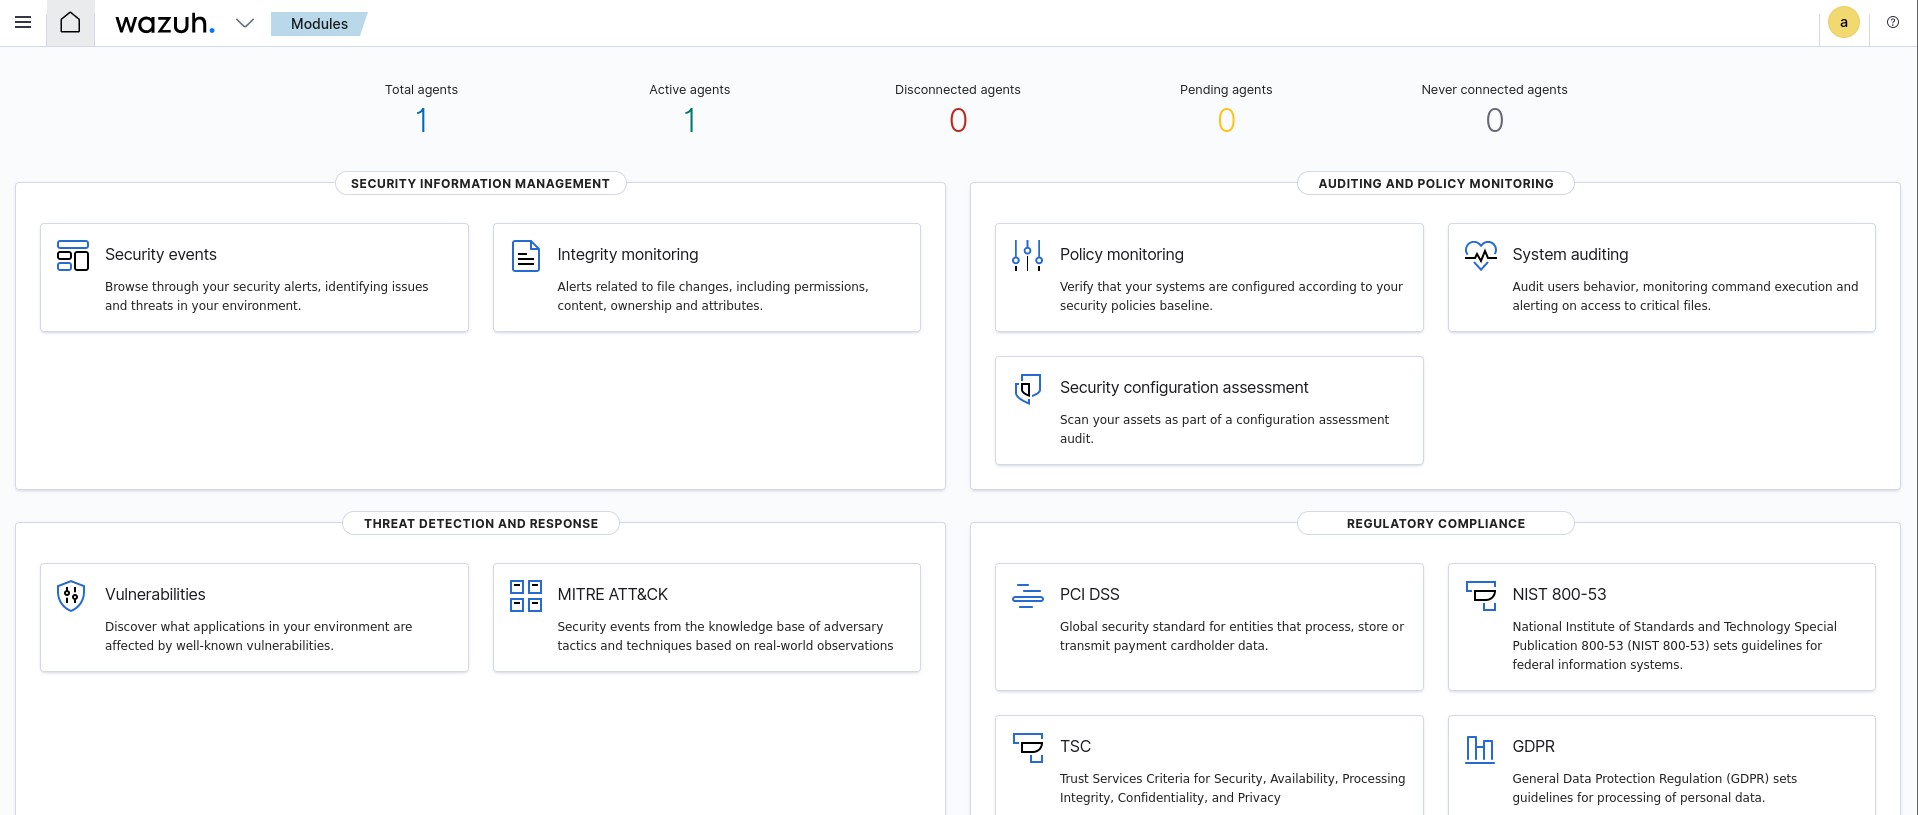
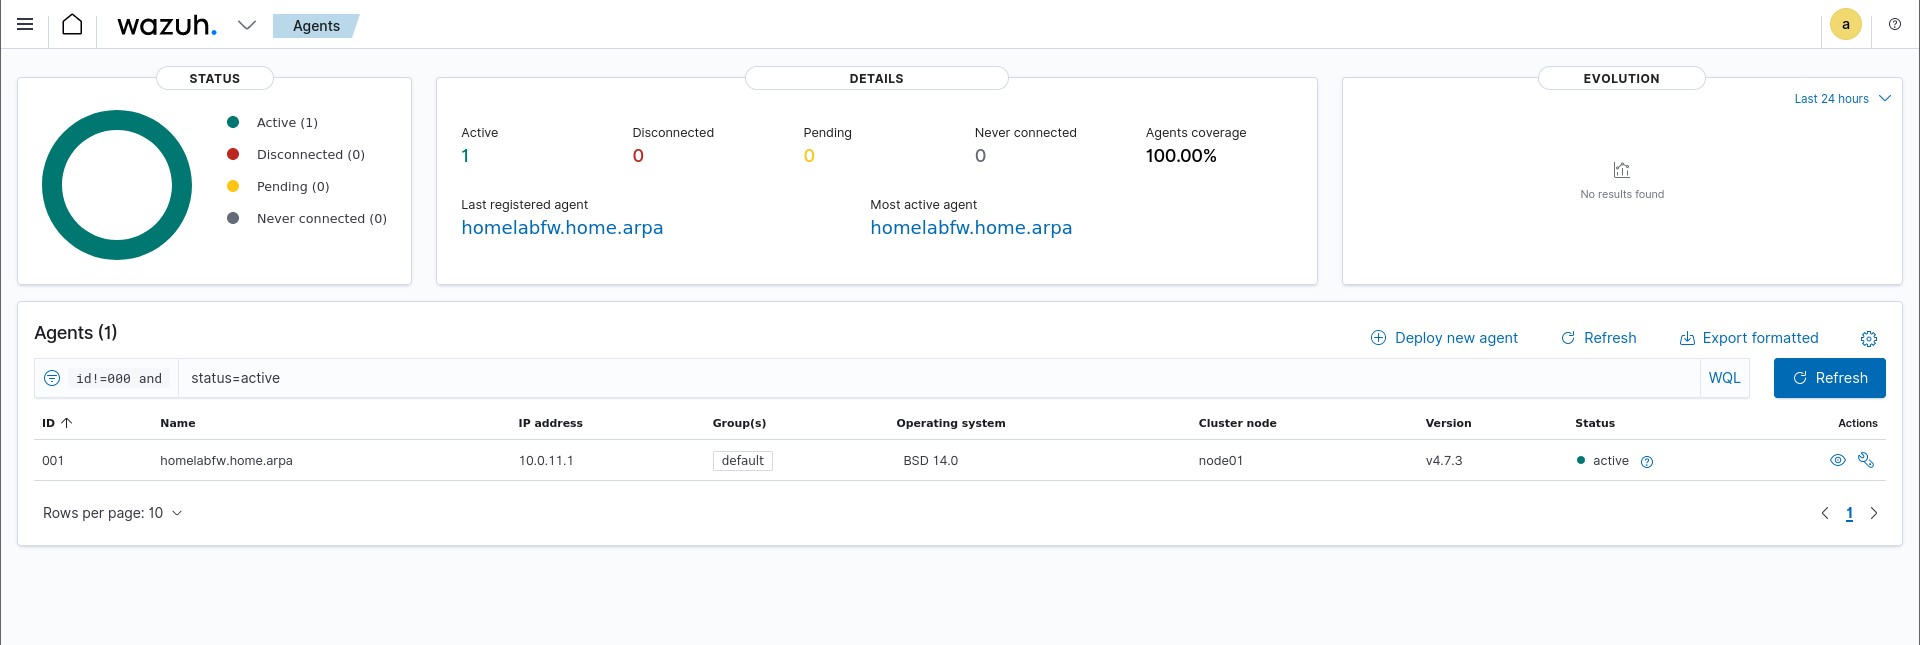
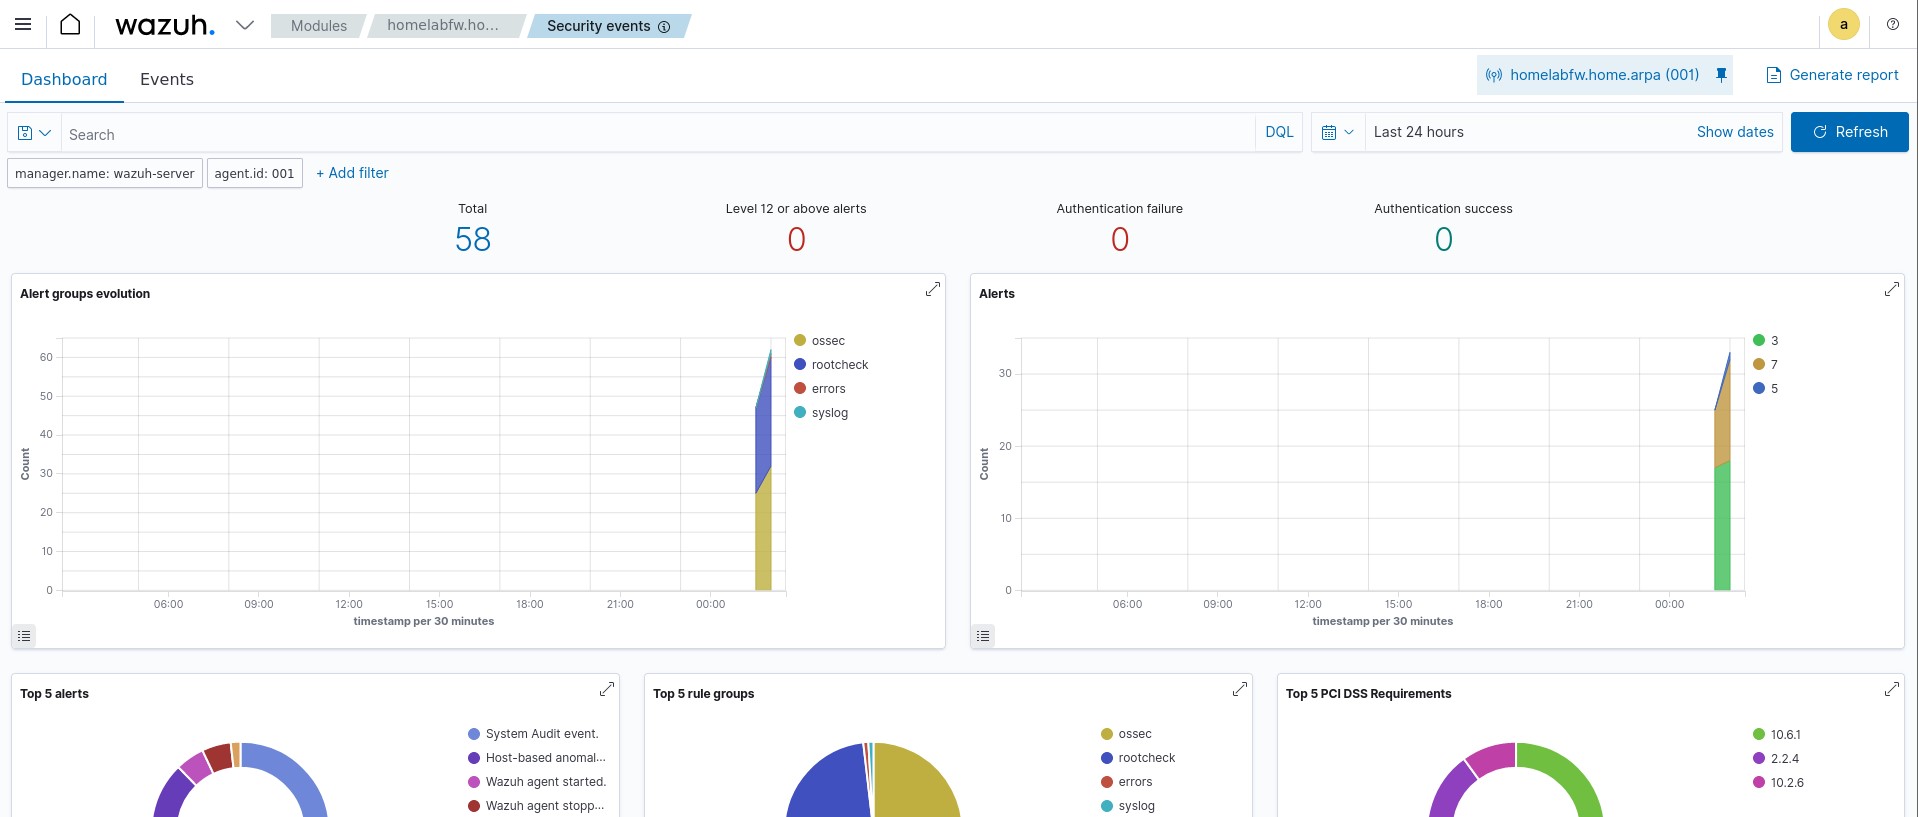
We can now head over to the Wazuh dashboard at 10.0.11.3 from our Kali machine. Our dashboard should now be populated with one active agent, and if we click on it we can see that it’s our pfSense agent.
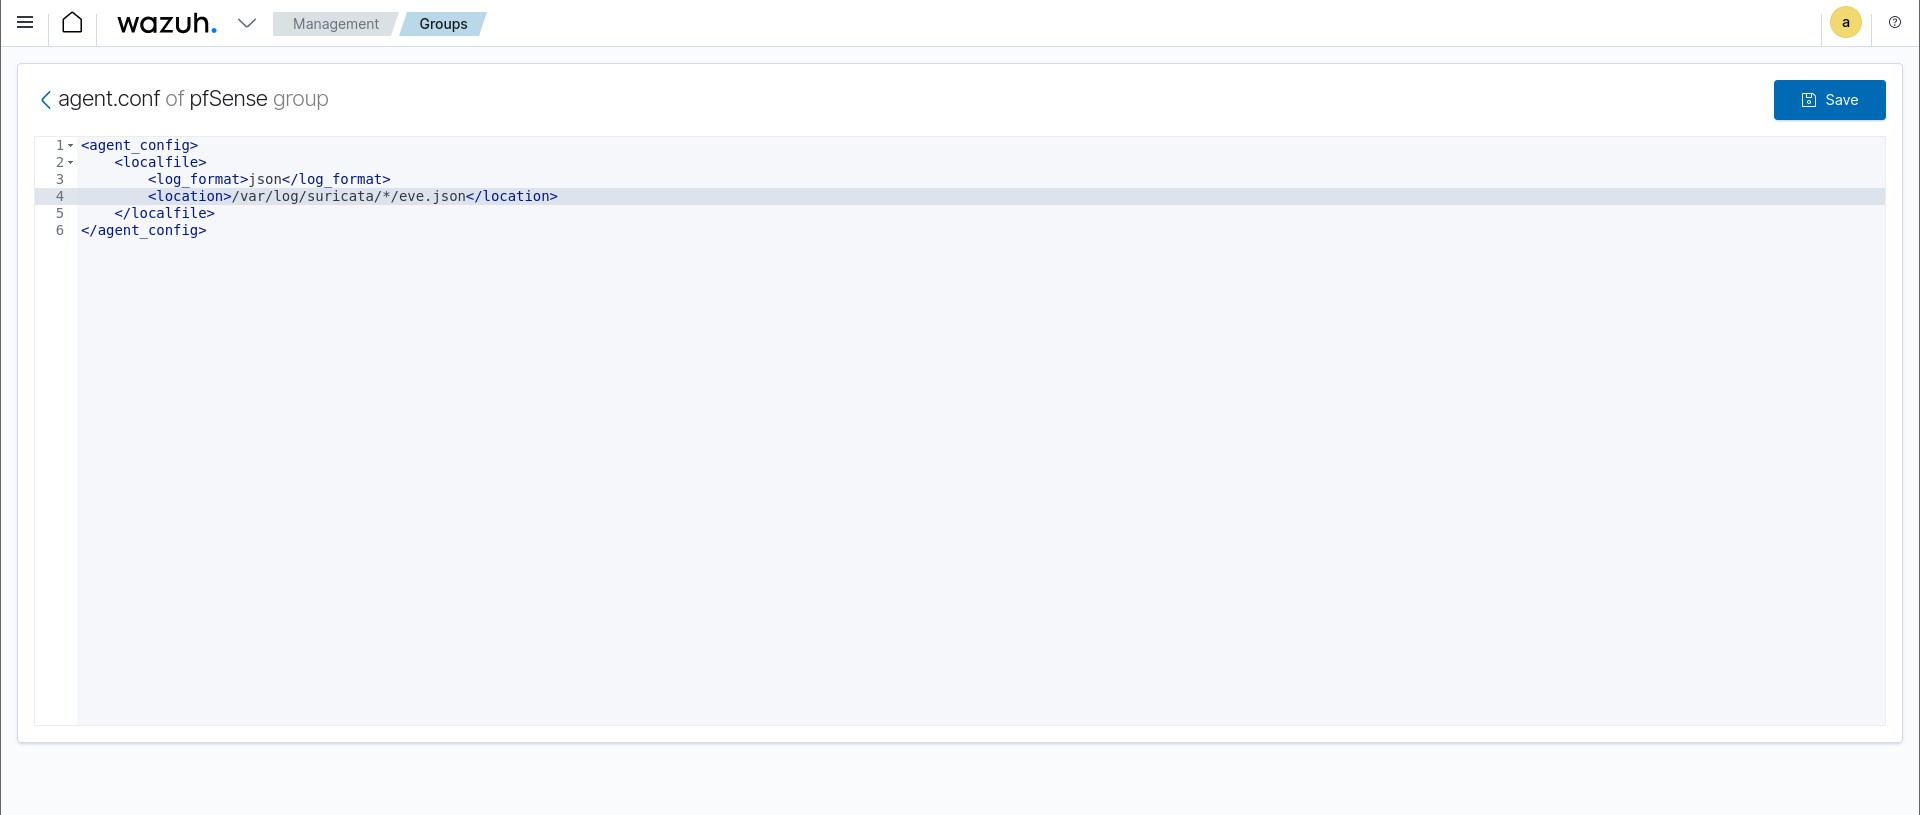
Now we can actually begin to have Suricata logs ingested into Wazuh. On the homepage click the dropdown arrow and under to ‘Management’ click ‘Groups’. Click on ‘Add New Group’ and name it ‘pfSense’. Then click the pencil icon to edit the group configuration settings. You will be presented with the empty agent.conf file of the pfSense group. We need to add the following lines:
<localfile>
    <log_format>json</log_format>
    <location>/var/log/suricata/*/eve.json</location>
</localfile>
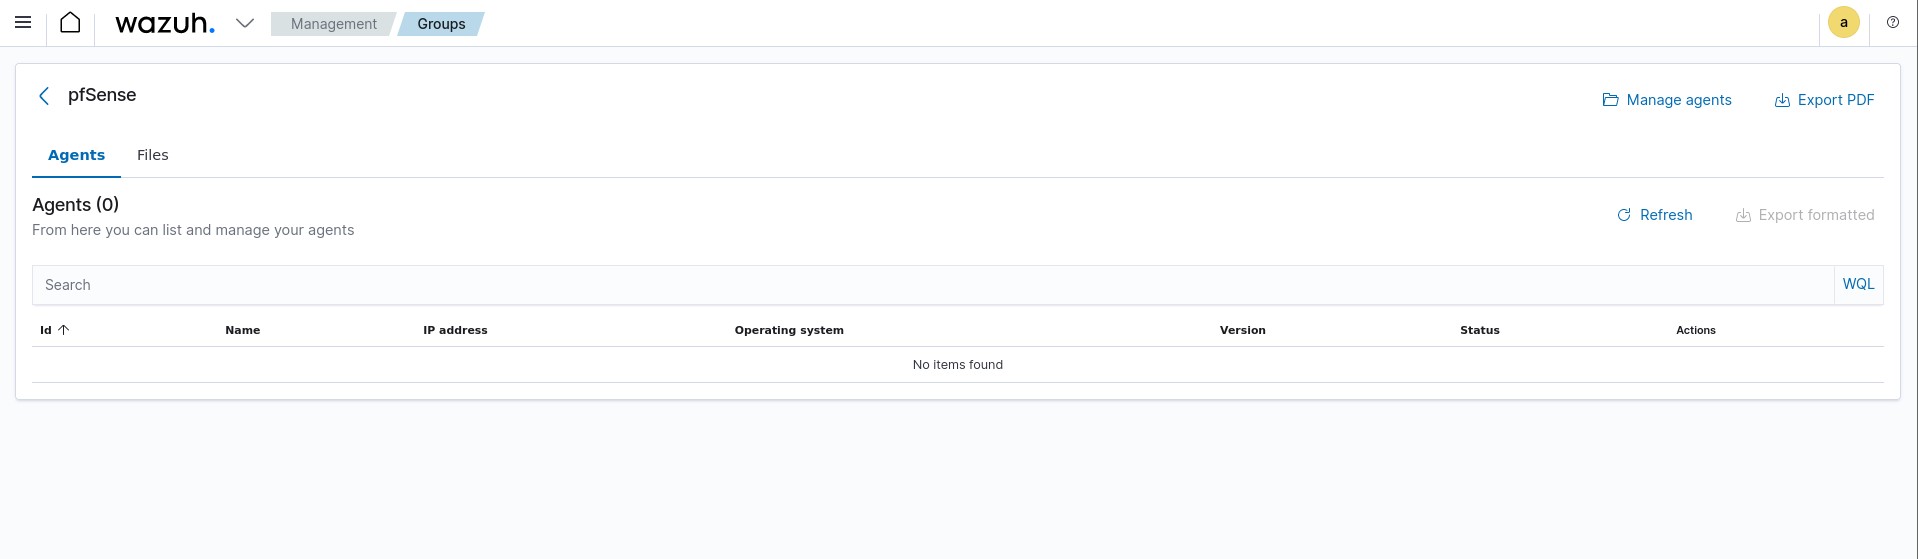
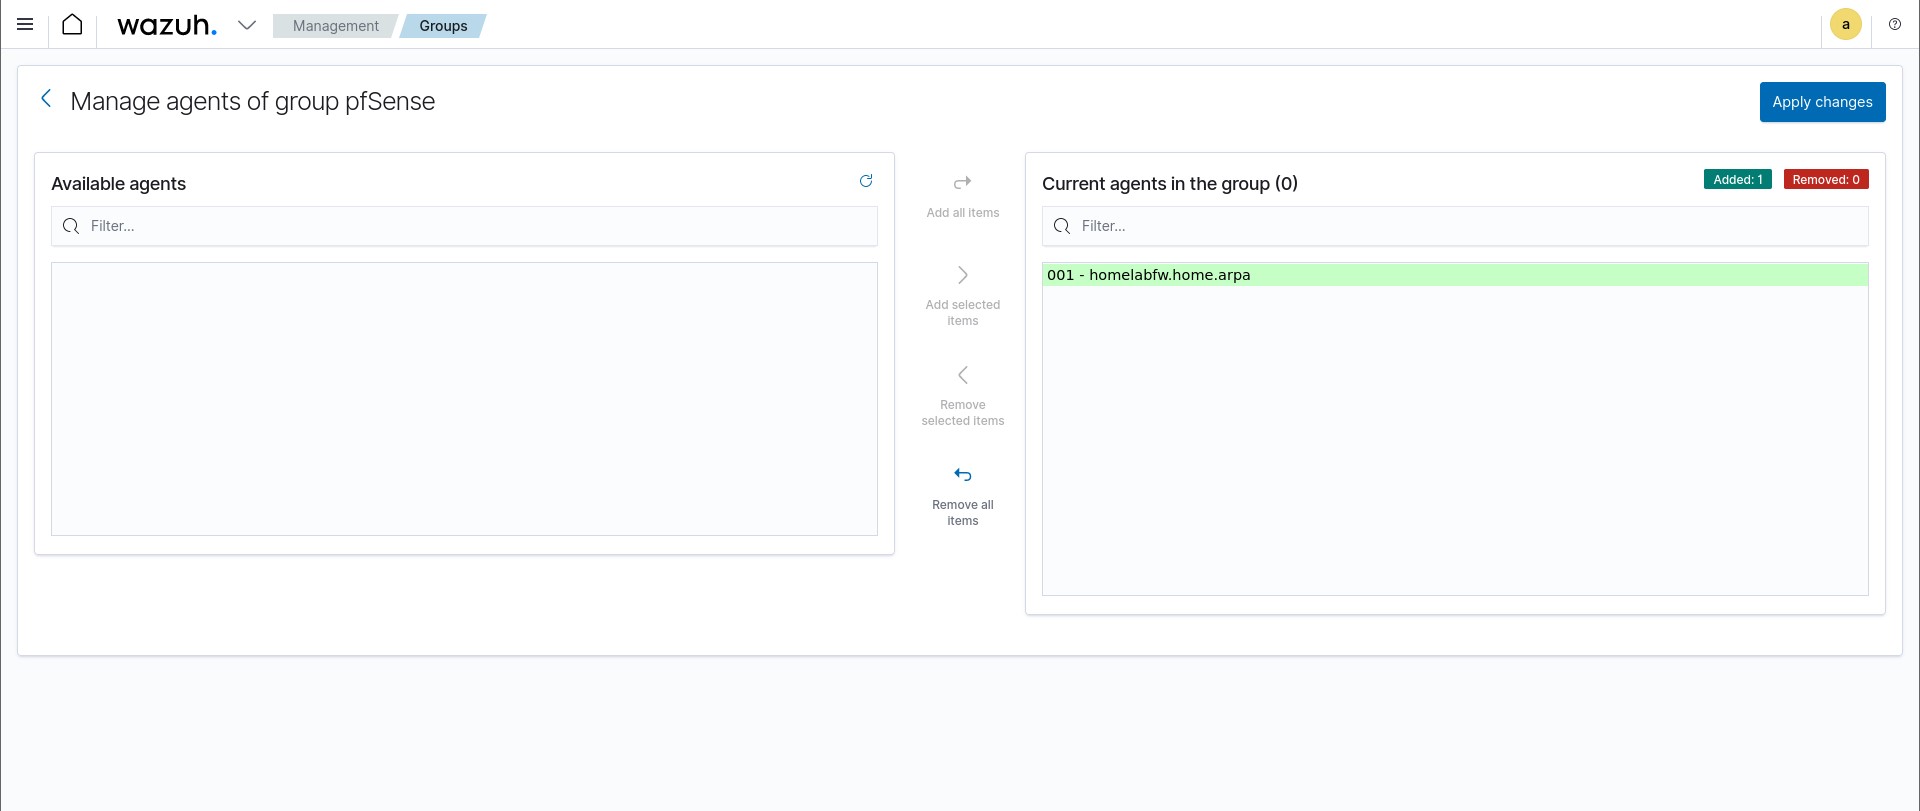
Click on the group we just created and then click ‘Manage Agents’. Select the pfSense agent and add it to the group. We can also go ahead and remove pfSense from the default group.
After this is complete, assuming Suricata is currently active on our interfaces in pfSense, we should now be getting logs from Suricata in our Wazuh dashboard! If we click on our agent within the dashboard, we can now view security events based on the logs we receive from Suricata. I went ahead and did some nmap scans from my Kali machine towards the Vulnhub VM, so it’s already a bit populated.
This brings us to the very end of the homelab build. Congrats on making it to the end and good luck on your security journey!